Upload any spreadsheet. Get a dashboard in 2 minutes.
No formulas. No SQL. No setup. Just answers.
No credit card required. Works with any spreadsheet.
Trusted by ops & finance teams
Join 200+ teams who replaced manual reporting with Sheetora.
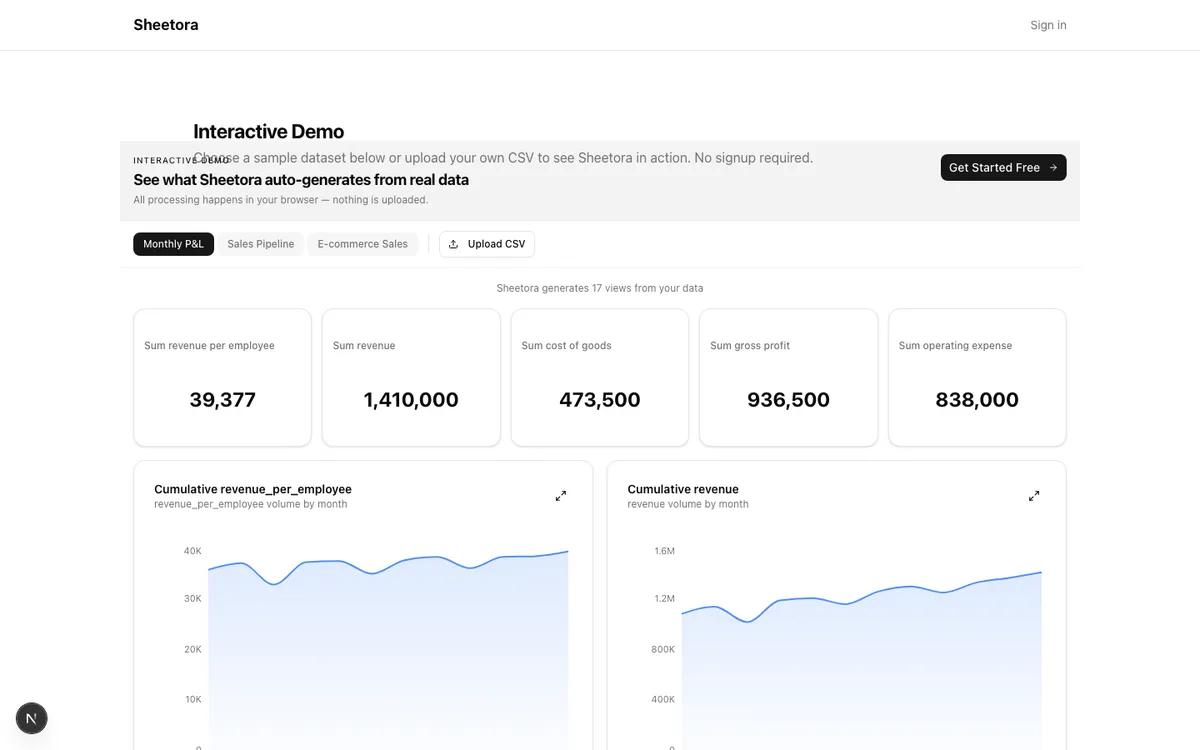
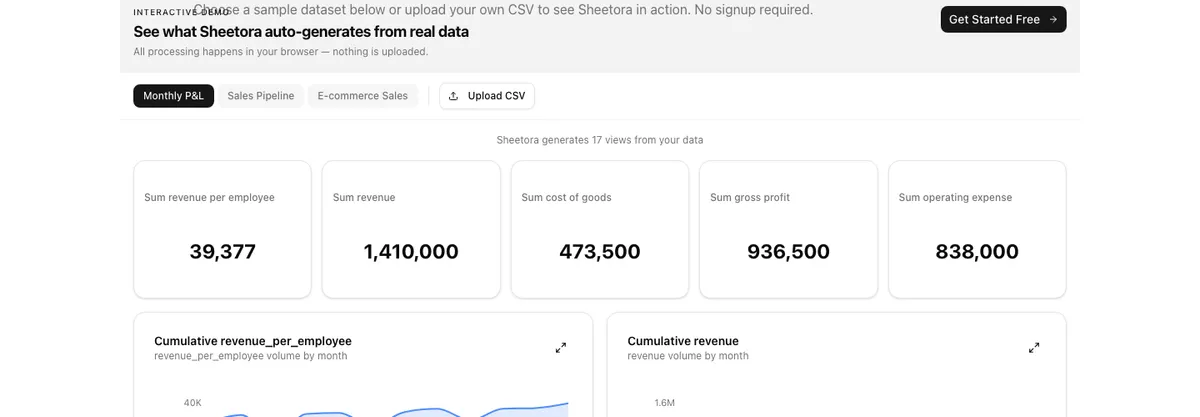
See it in action
Watch how a CSV becomes a full dashboard in under 2 minutes
Stop manually building reports every week
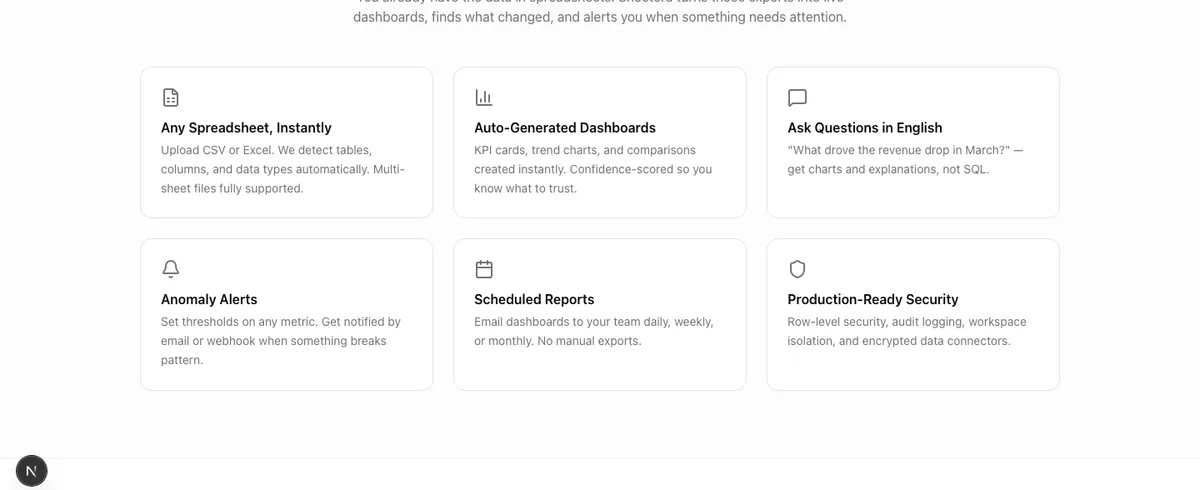
You already have the data in spreadsheets. Sheetora turns those exports into live dashboards, finds what changed, and alerts you when something needs attention.
Any Spreadsheet, Instantly
Upload CSV or Excel. We detect tables, columns, and data types automatically. Multi-sheet files fully supported.
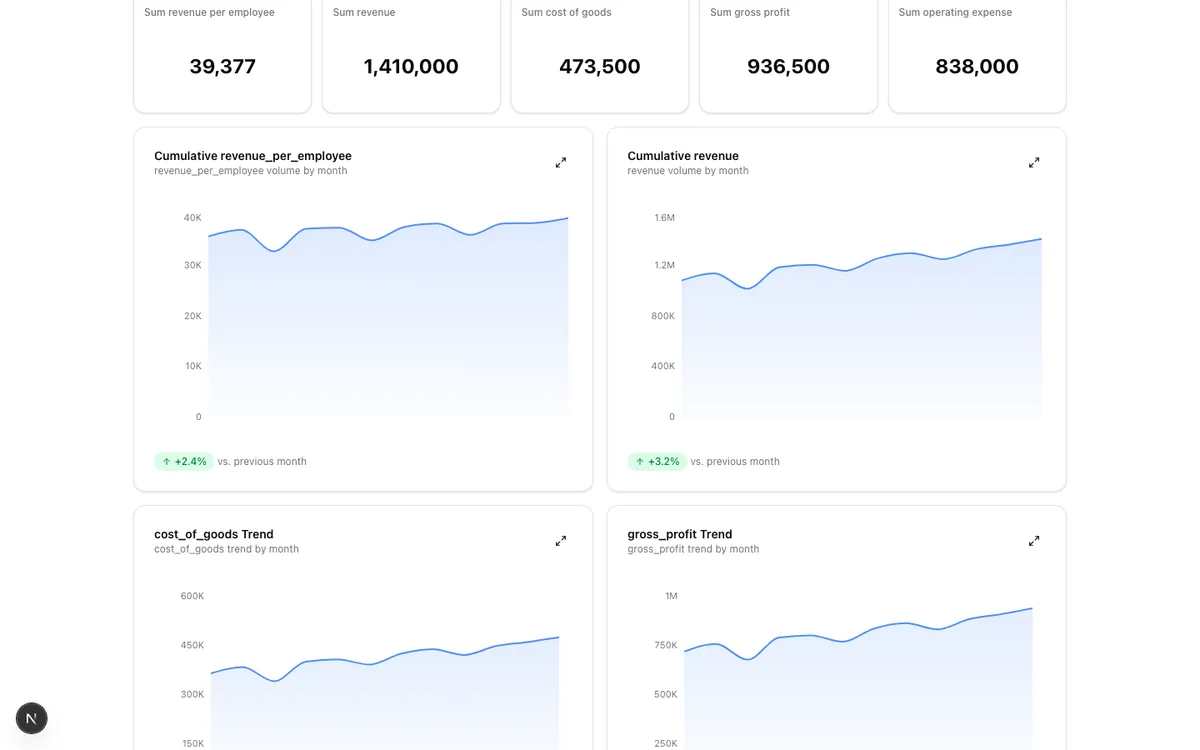
Auto-Generated Dashboards
KPI cards, trend charts, and comparisons created instantly. Confidence-scored so you know what to trust.
Ask Questions in English
"What drove the revenue drop in March?" — get charts and explanations, not SQL.
Anomaly Alerts
Set thresholds on any metric. Get notified by email or webhook when something breaks pattern.
Scheduled Reports
Email dashboards to your team daily, weekly, or monthly. No manual exports.
Production-Ready Security
Row-level security, audit logging, workspace isolation, and encrypted data connectors.
What you get out of the box
No configuration. No training. No waiting for IT.
<2 min
From file upload to full dashboard
Drag & drop a CSV or Excel file. KPIs, charts, anomalies, and a plain-English summary appear automatically.
10+
Chart types auto-generated
Bar, line, scatter, heatmap, treemap, Pareto, and more — picked automatically based on your data structure.
0
SQL or formulas required
Ask questions in plain English. Set alerts by clicking thresholds. Share dashboards with a link.
From file to insight in 3 steps
No configuration. No training. No waiting for IT.
Upload
Drag & drop the spreadsheet you already have. CSV, Excel, multi-sheet — all work.
Auto-Analyze
AI detects columns, builds charts, finds anomalies, and writes a plain-English summary.
Act on It
Set alerts, schedule reports, share dashboards, or ask follow-up questions.
Built for people who run on spreadsheets
If you export reports weekly and wish they were dashboards, this is for you.
Finance Teams
“Spending 4 hours every Monday formatting P&L exports into slides”
Upload the export. Get a dashboard with margin trends, expense anomalies, and budget variance — instantly.
Sales & Revenue Ops
“Pipeline reviews mean pulling CRM exports and pivot-tabling by hand”
Drop in the pipeline CSV. See win rates, stage conversion, and quota gaps without touching a formula.
Operations Managers
“Tracking fulfillment SLAs across spreadsheets with no alerting”
Upload your ops export. Set threshold alerts on any metric. Get emailed when SLAs slip.
SMB Founders
“Want a business dashboard but can't justify the cost of a BI tool”
Free tier covers your first datasets. Upload anything — Stripe exports, QuickBooks, inventory logs.
Replace hours of manual work
What used to take half a day now takes 2 minutes
<2 min
File to dashboard
10+
Chart types auto-generated
0
SQL or formulas needed
24/7
Anomaly monitoring
Real workflows, replaced
Before
Every Monday: export from QuickBooks, open Excel, build pivot tables, format charts, paste into slides, email to leadership.
After Sheetora
Upload the QuickBooks export once. Dashboard auto-updates. Schedule weekly email to leadership.
4 hours/week saved
Before
Sales manager pulls HubSpot export, manually calculates win rates per rep, flags deals stuck in stage for 30+ days.
After Sheetora
Drop in the CRM export. Win rates, stage aging, and quota tracking appear instantly. Set alerts for stale deals.
Pipeline review in 2 minutes
Before
Ops lead downloads fulfillment report, ctrl+F for SLA breaches, manually tallies late shipments, sends Slack updates.
After Sheetora
Upload fulfillment CSV. Anomaly detection flags SLA breaches. Alerts fire automatically when thresholds are crossed.
Zero missed SLA breaches
“We used to spend 3 hours every Monday building our ops dashboard in Excel. With Sheetora we upload the CSV and it's done in 2 minutes. The anomaly alerts alone caught two data errors we would have missed.”— Operations Manager, SaaS company (50–200 employees)
Why not just use ChatGPT or Excel?
Sheetora is purpose-built for turning spreadsheets into recurring insight — not one-off chat.
| Feature | Sheetora | ChatGPT | Excel / Sheets | BI Tools |
|---|---|---|---|---|
| Upload → dashboard | < 2 min, automatic | Manual prompting | Build from scratch | Hours of setup |
| Anomaly detection | Auto, with alerts | On request only | Manual formulas | Requires config |
| Scheduled reports | Built-in email | Not available | Manual | Available |
| Multi-sheet support | Auto-detect tables | Limited | Manual linking | Requires modeling |
| Plain English queries | Yes, with charts | Text only | Not available | Limited |
| Data trust / lineage | Source labels + confidence | Hallucination risk | Formula tracing | Available |
| No SQL / formulas | Yes | Yes | No | No |
| Team sharing | RBAC + share links | Copy-paste | File sharing | Available |
Swipe to see all columns →
Simple, transparent pricing
Start free. Upgrade when you need more.
Free
$0/mo
For trying it out
- ✓ 3 datasets
- ✓ 5 AI questions/day
- ✓ Basic dashboards
Pro
$15/mo
Billed $180/yr
- ✓ Unlimited datasets
- ✓ Unlimited AI questions
- ✓ Alerts, reports & sharing
Your data stays yours
Built for teams that handle sensitive financial and operational data.
Row-level security
Every table has per-user access controls and workspace isolation
Full audit trail
Every login, upload, query, and share event is logged and searchable
Workspace isolation
Team data is siloed — no cross-workspace leakage
Your data, your control
Delete your datasets anytime. We never train AI models on your data
How AI works in Sheetora: AI analysis runs on our secure servers. Your spreadsheet data is processed only to generate your dashboards and answer your questions — it is never stored beyond your session, never shared with third parties, and never used to train AI models. Data is encrypted in transit (TLS 1.3) and at rest (AES-256). Hosted on US cloud infrastructure. Privacy Policy
Stop copy-pasting into slide decks
Upload your spreadsheet. Get a dashboard. Share it with your team.
Free to start. No credit card required.